Viewing usage report from admin portal dashboard
The Matrx Dashboard allows adminis with relevant permission to view statistics ranging from overall usage on Matrx to detailed statistics for different modules. These statistics can be used to analyze possible problems and better understand how users use Matrx.
Dashboard statistics update daily at 00:00 UTC+4 daily. Data is stored in the Dashboard for 12 months.
Prerequisites
- Business or Enterprise plan
- Admin role access with Dashboard permission
Getting Started
- Sign in to the Matrx admin portal.
- In the navigation menu, click Dashboard.
Understanding the Statistics
The statistics include:
- Numbers of users
- Active Users - The number of active users in the organization.
- Total Users - The number of activated users in the organization.
- The number of enterprises - The total number of enterprises in the current organization (including the top organization itself)
- Usage statistics of meetings
- Meetings - The total amount of meetings hosted.
- Meeting Minutes - The total amount of meeting minutes.
- Participants - The total amount of meeting participants.
- Usage statistics of 1-on-1 Calls
- 1-on-1 Calls - The total amount of 1-on-1 calls.
- 1-on-1 Call Minutes - The total amount of 1-on-1 call minutes.
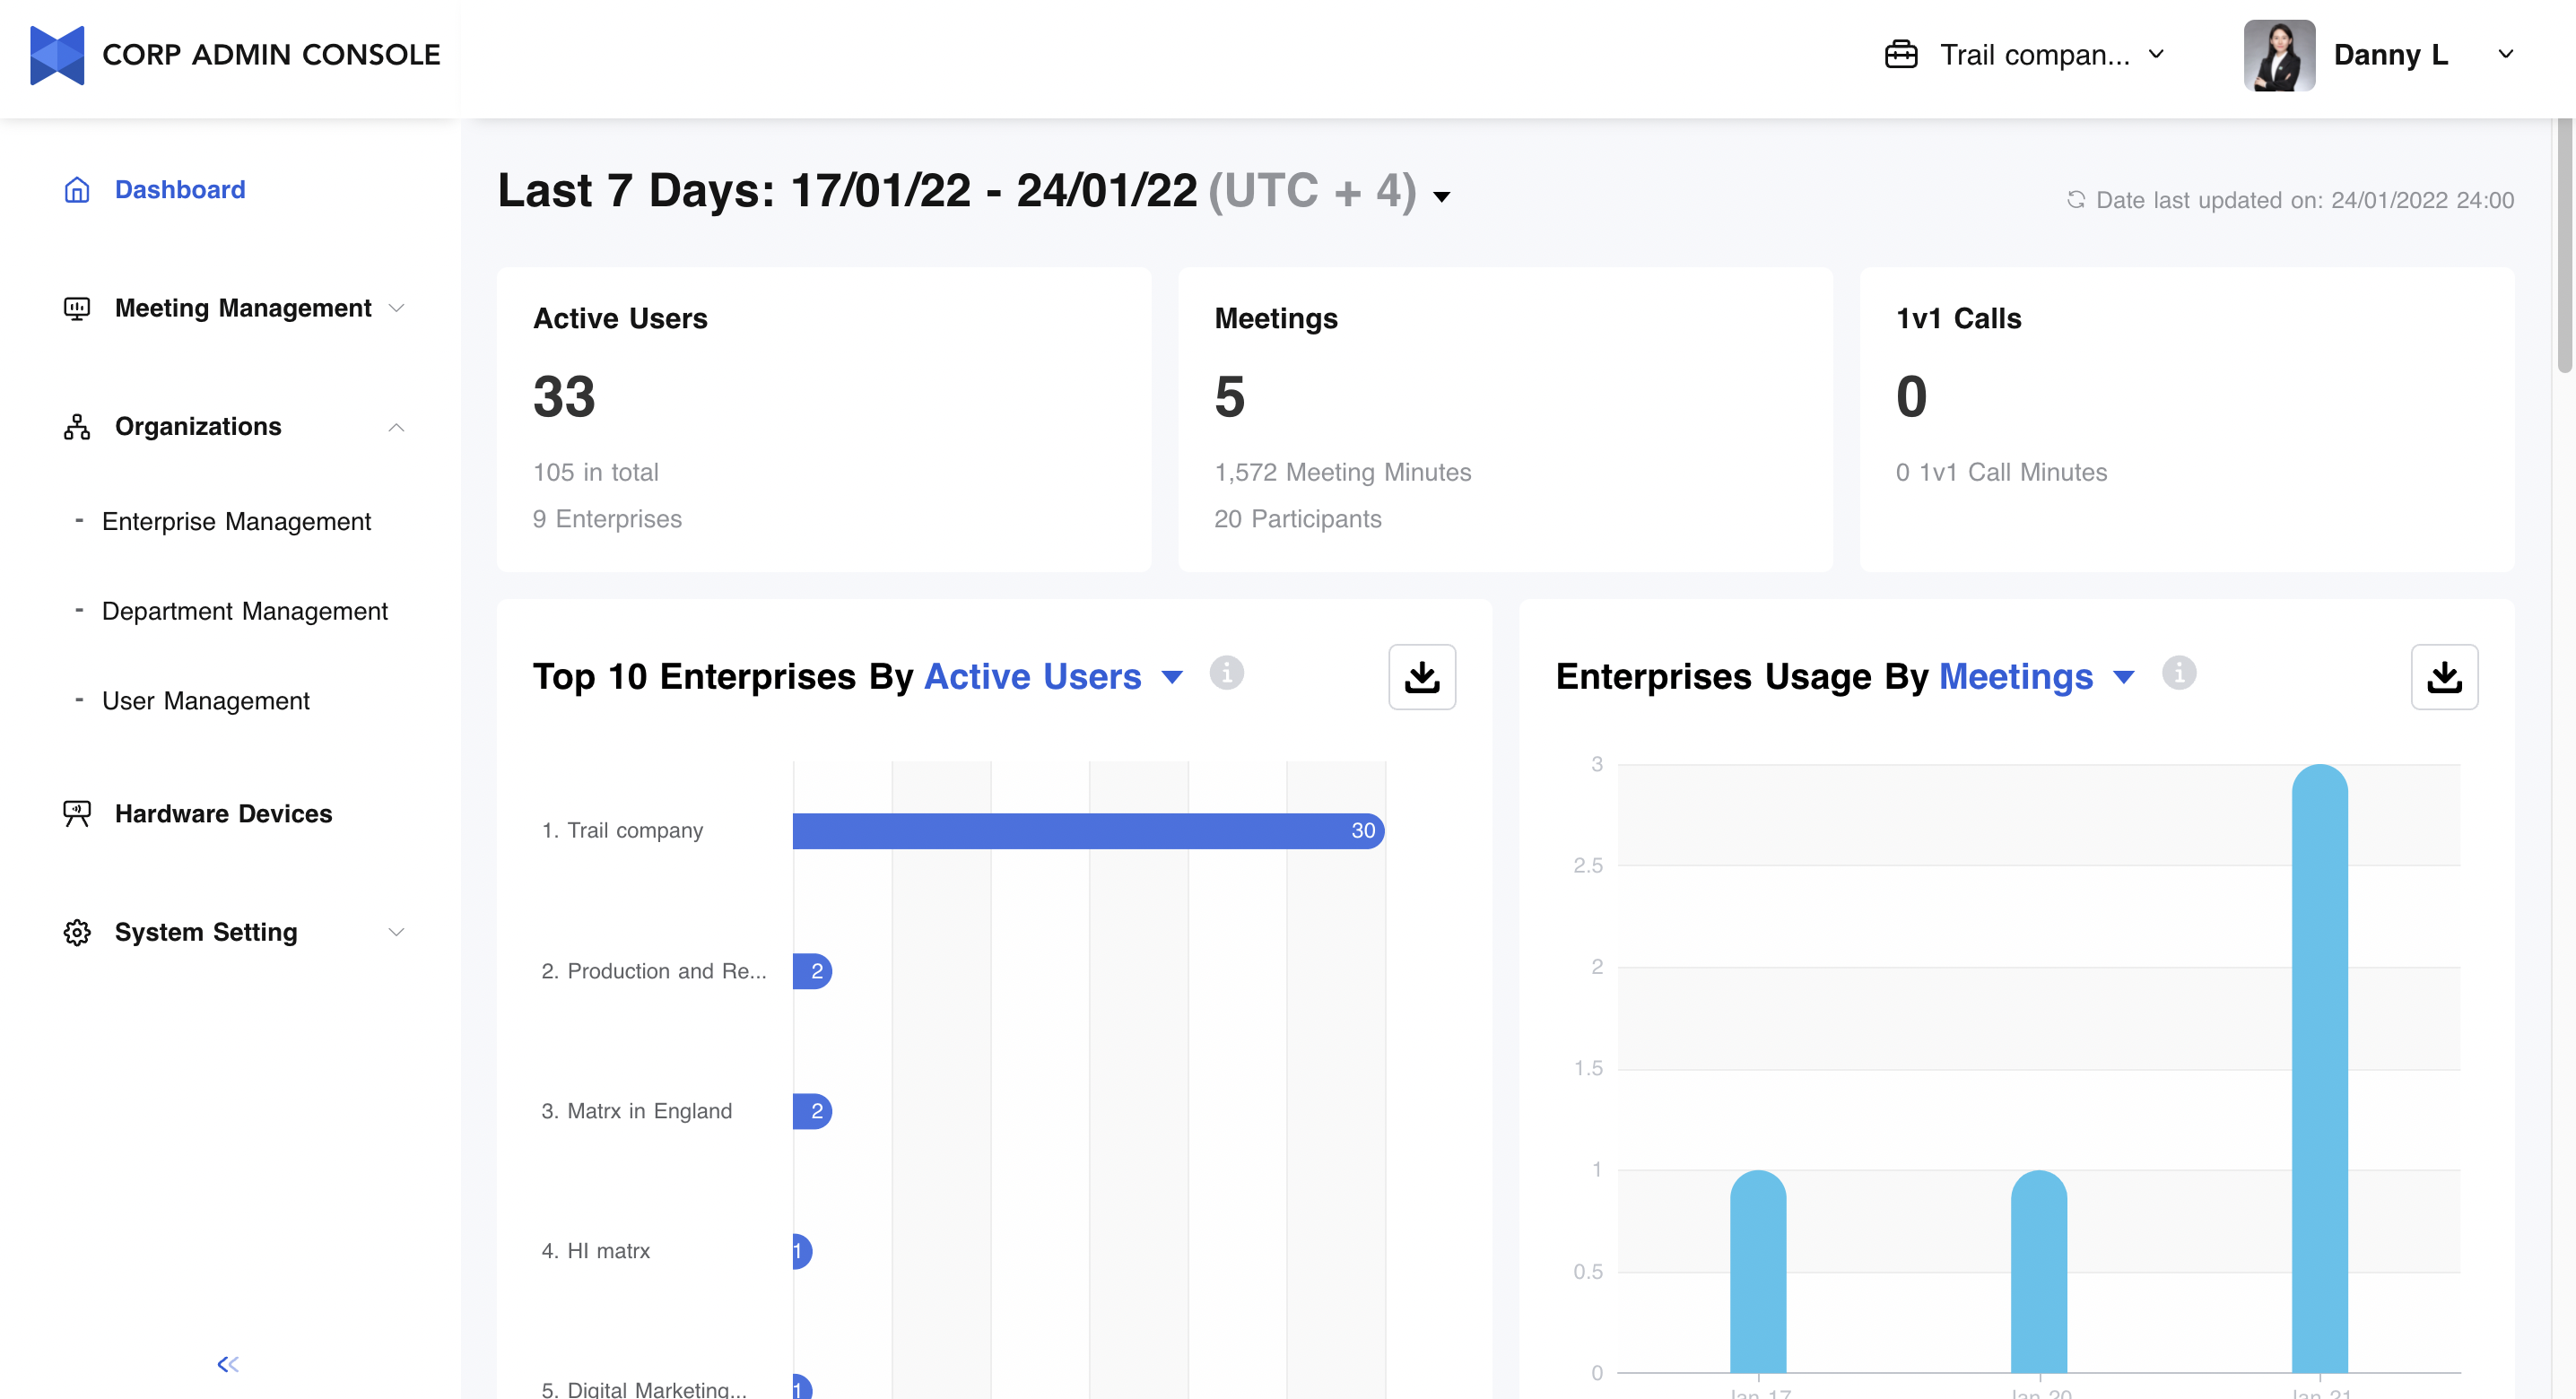
Understanding the Statistics through Different Dimensions
Multi-enterprise management is one of the most distinctive features of Matrx. The Matrx Dashboard can show a side-by-side comparison among different subsidiaries.
The statistics include:
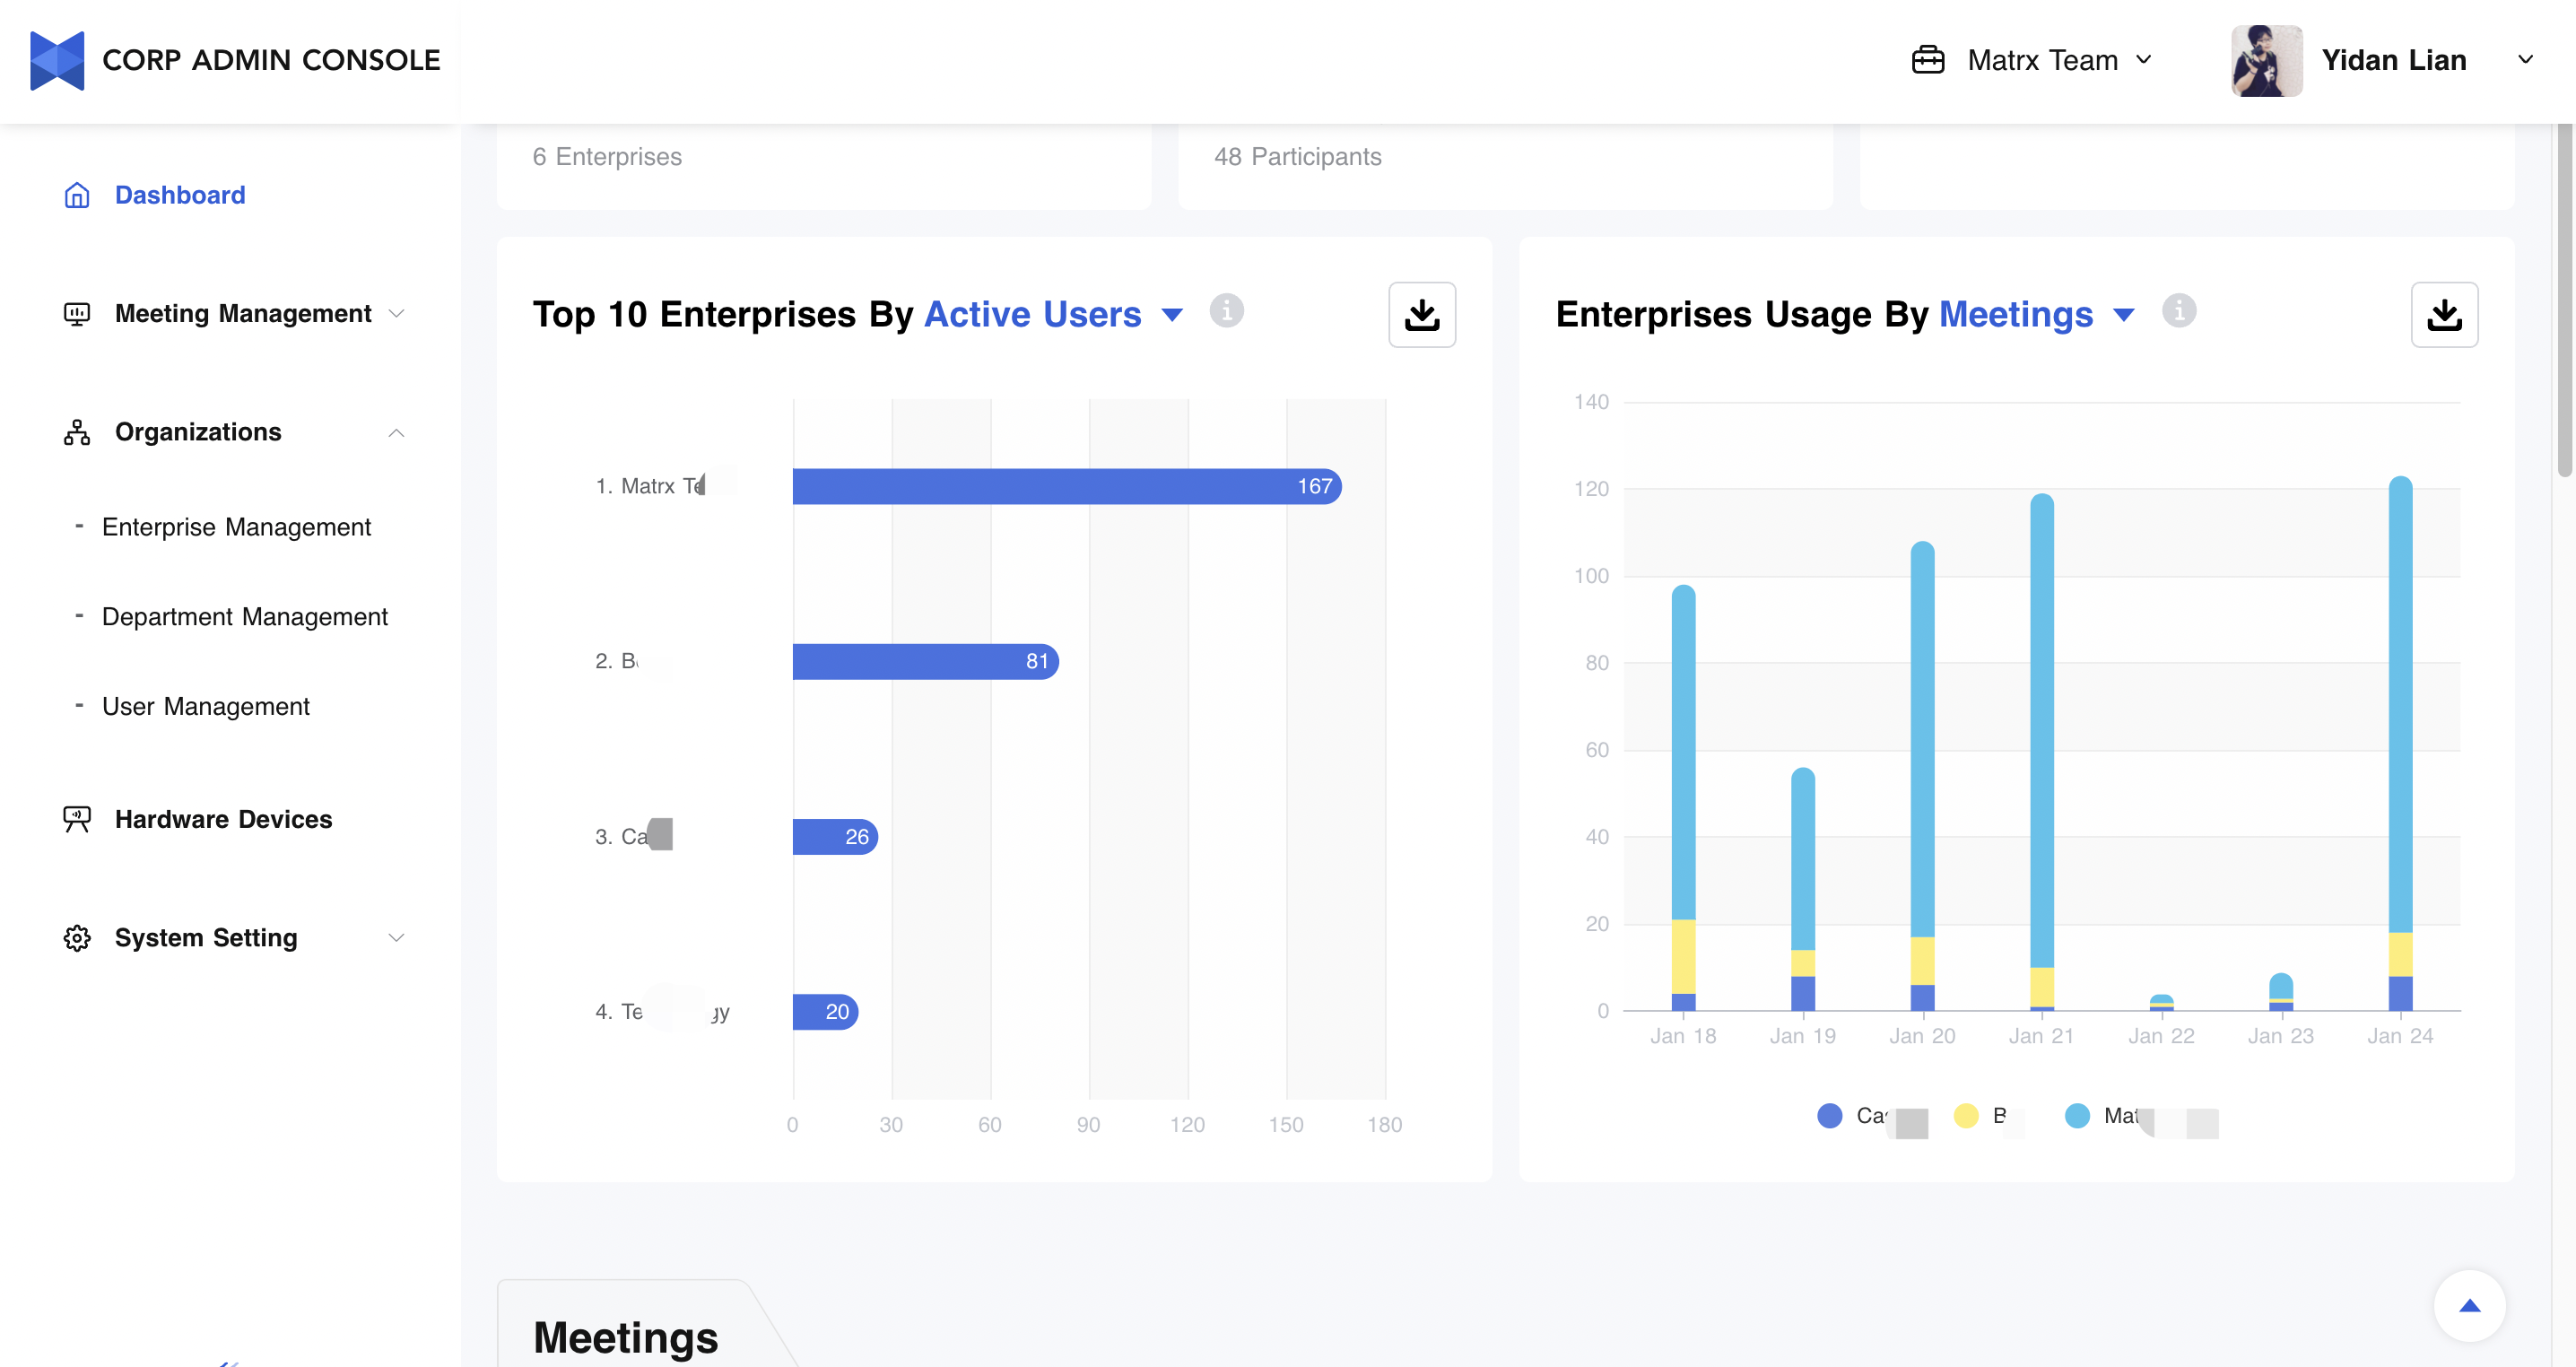
- Top 10 Enterprises By
- Active Users - The number of active users in the organization.
- User Active Rate - The number of active users/the number of total users.
- Meetings - The total amount of meetings hosted.
- Meeting Minutes - The total amount of meeting minutes.
- Enterprises Usage By
- Meetings - The total amount of meetings hosted.
- Meeting Minutes - The total amount of meeting minutes.
Understanding the Meeting Statistics through Different Dimensions
Meeting is the core function of Matrx, and multi-dimensional business data statistics help managers to have a deeper understanding of user usage in the organization.
The statistics include:
- Meeting
- Meetings - The total amount of meetings hosted.
- Meeting Minutes - The total amount of meeting minutes.
- Participants - The total amount of meeting participants.
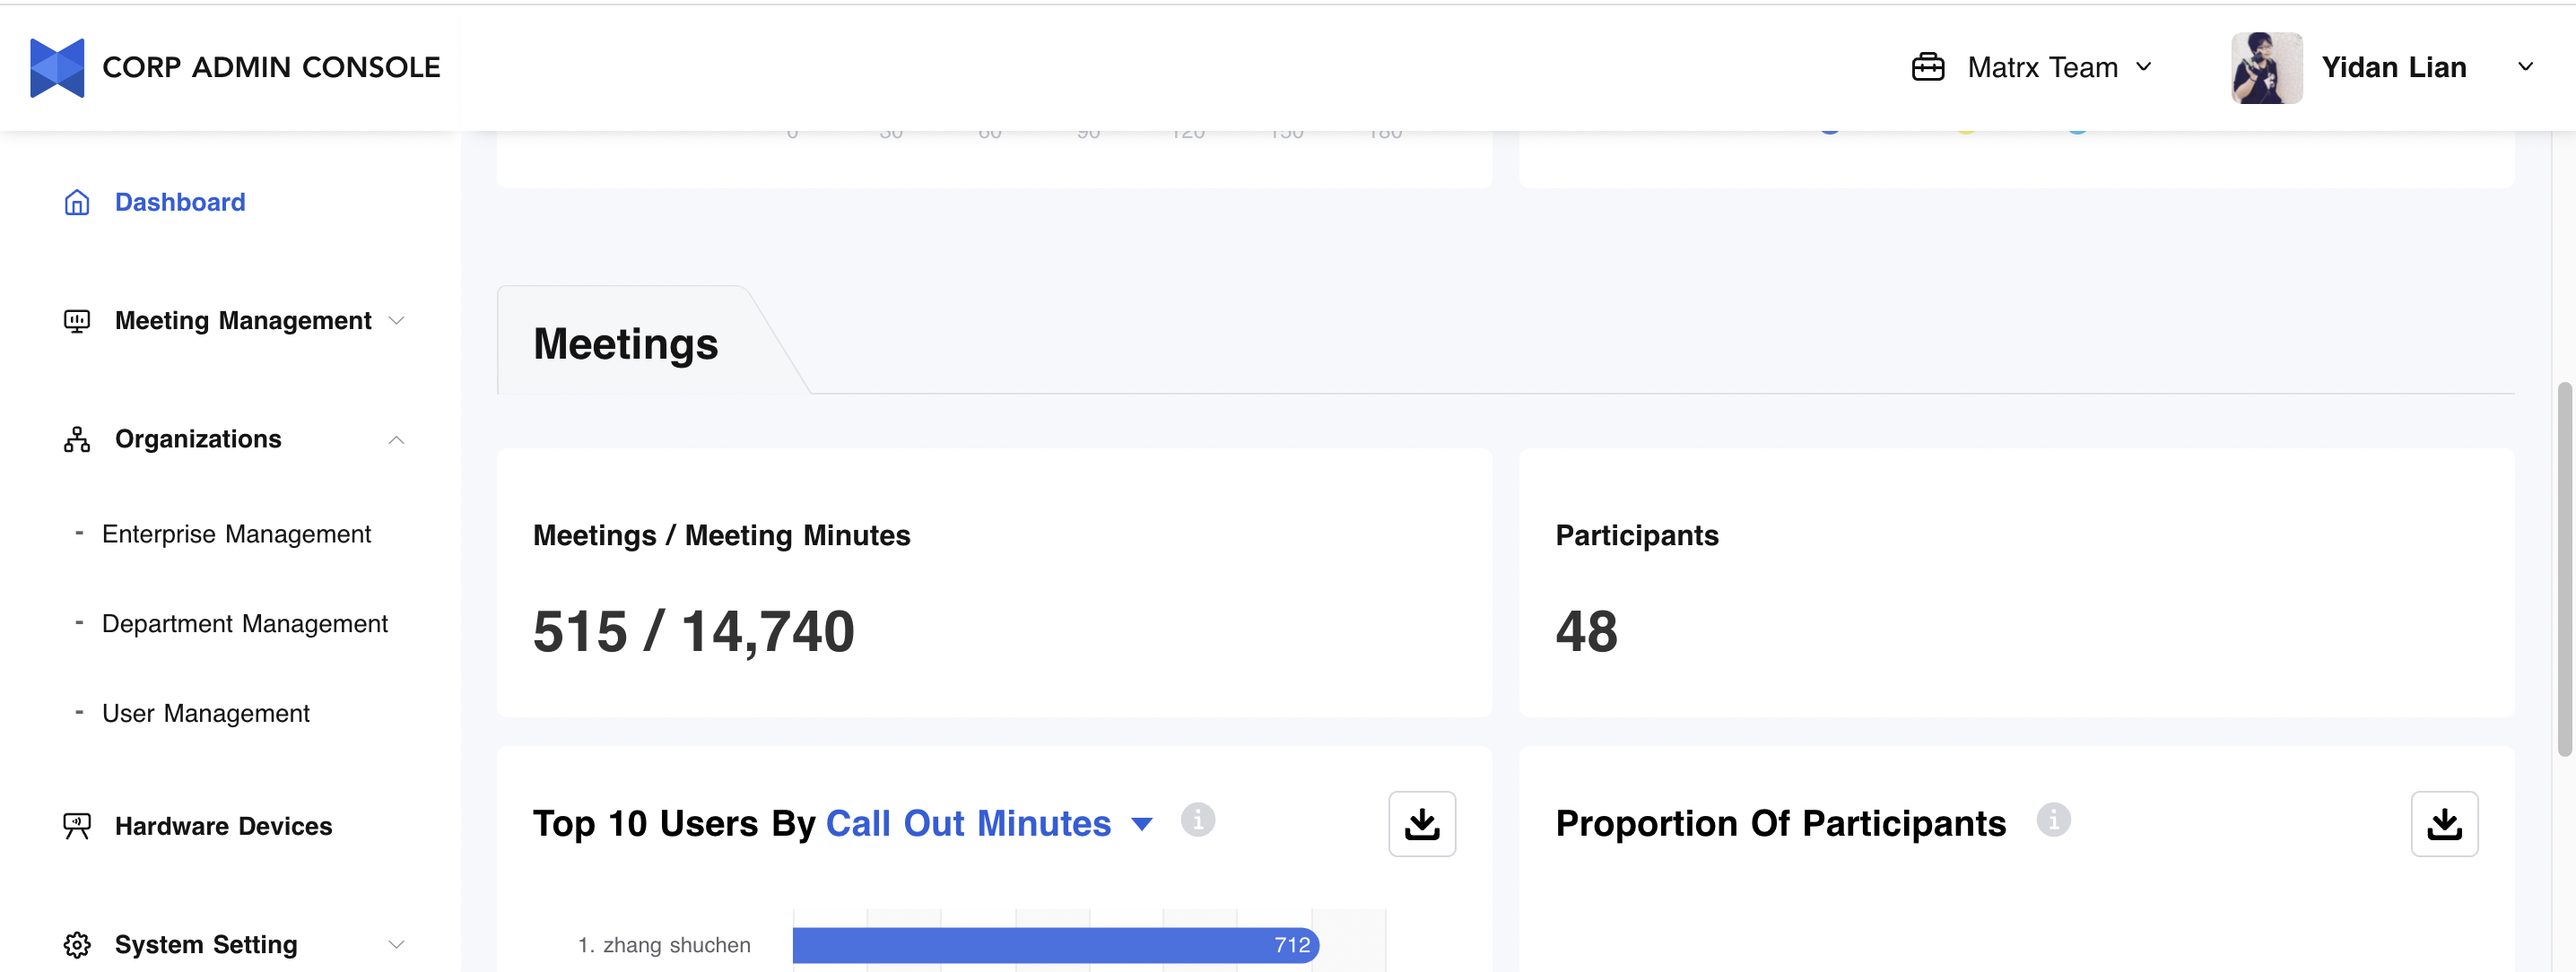
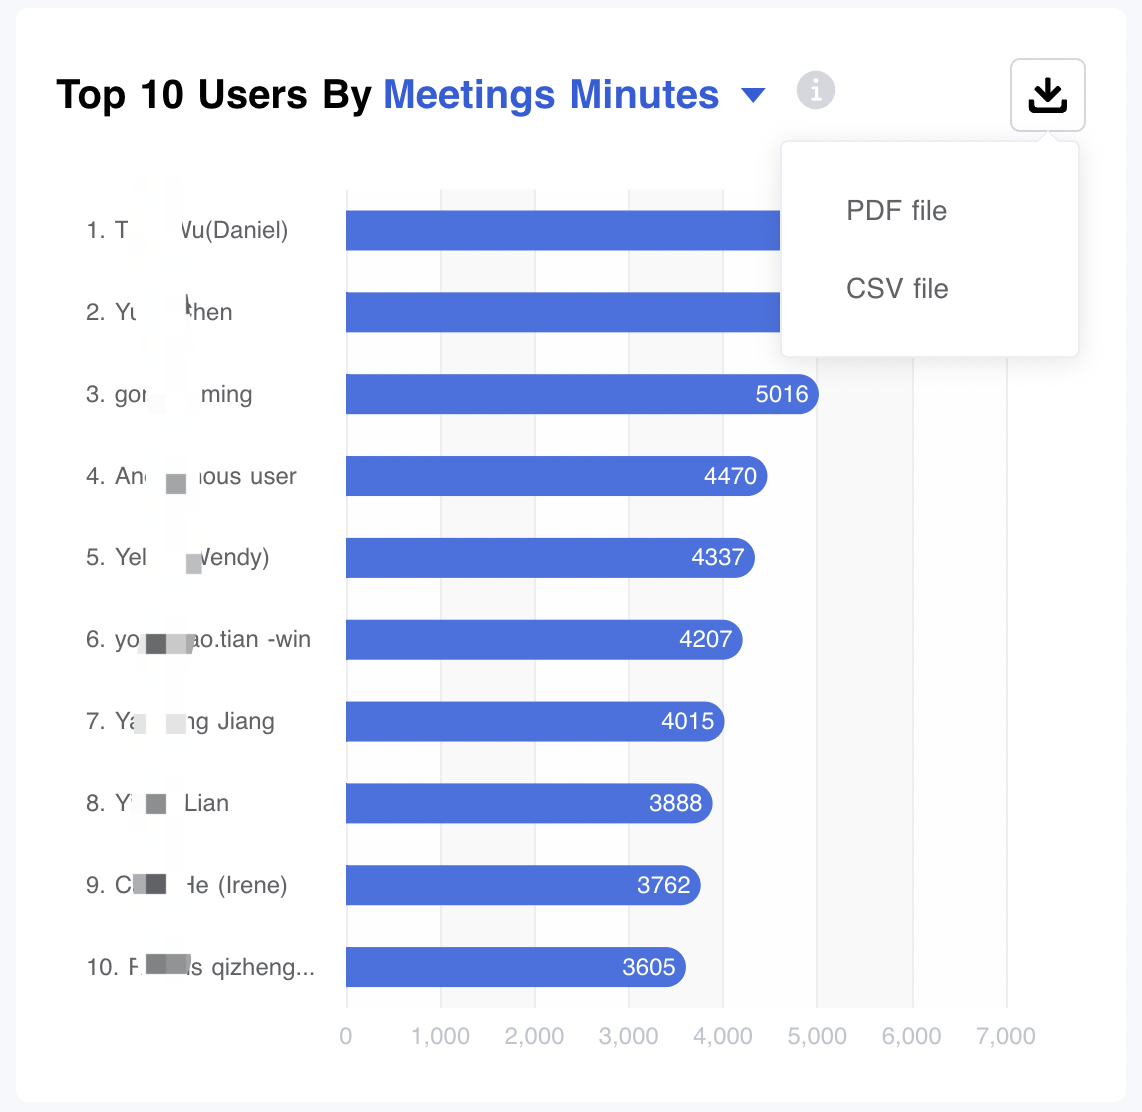
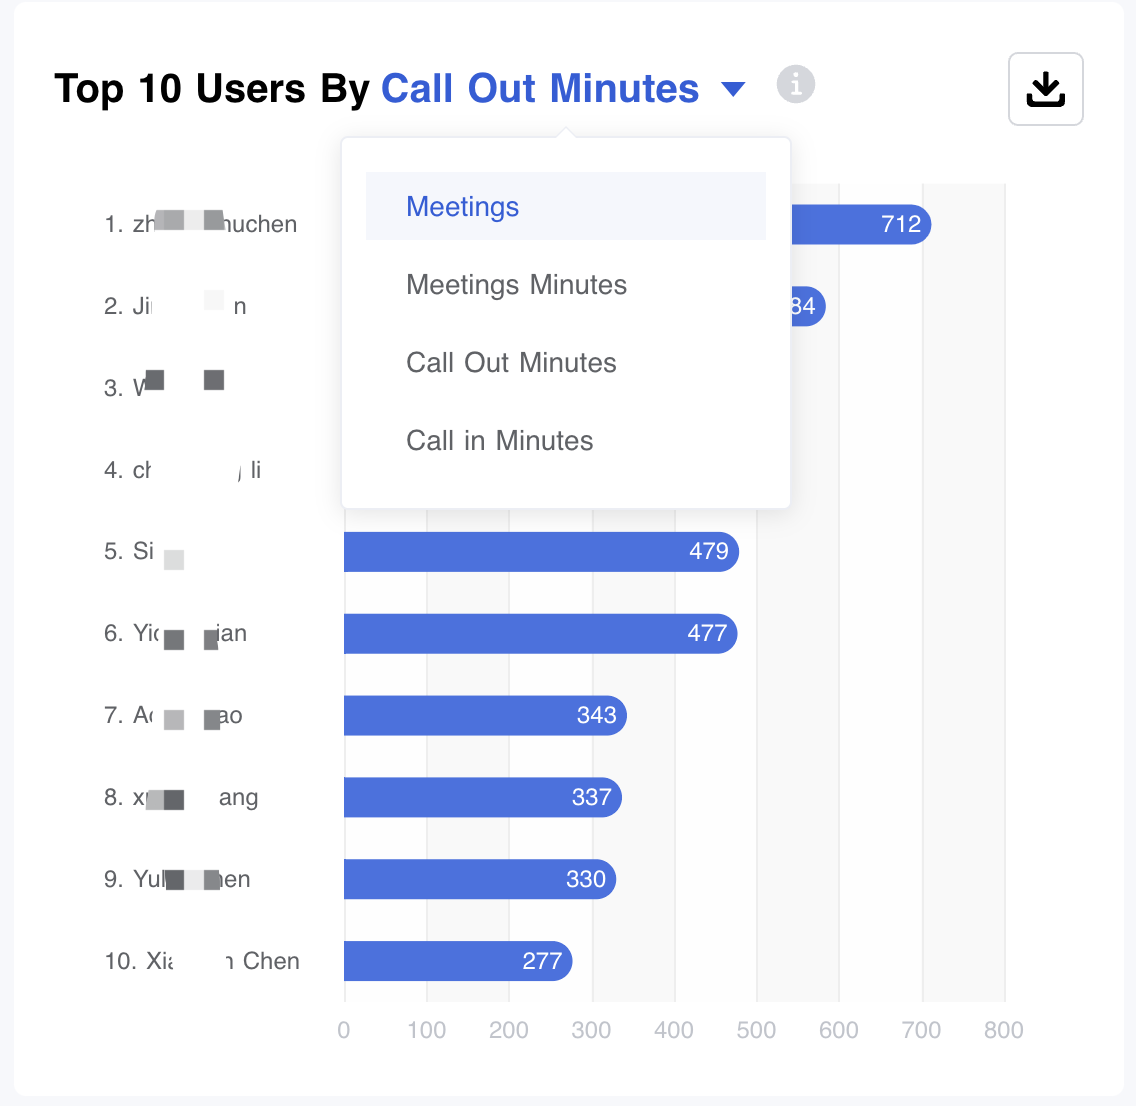
- Top 10 Users By
- Meetings - The total amount of meetings hosted.
- Meeting Minutes - The total amount of meeting minutes.
- Call Out Minutes - The total amount of meeting minutes for Call-out.
- Call In Minutes - The total amount of meeting minutes for Call-in.
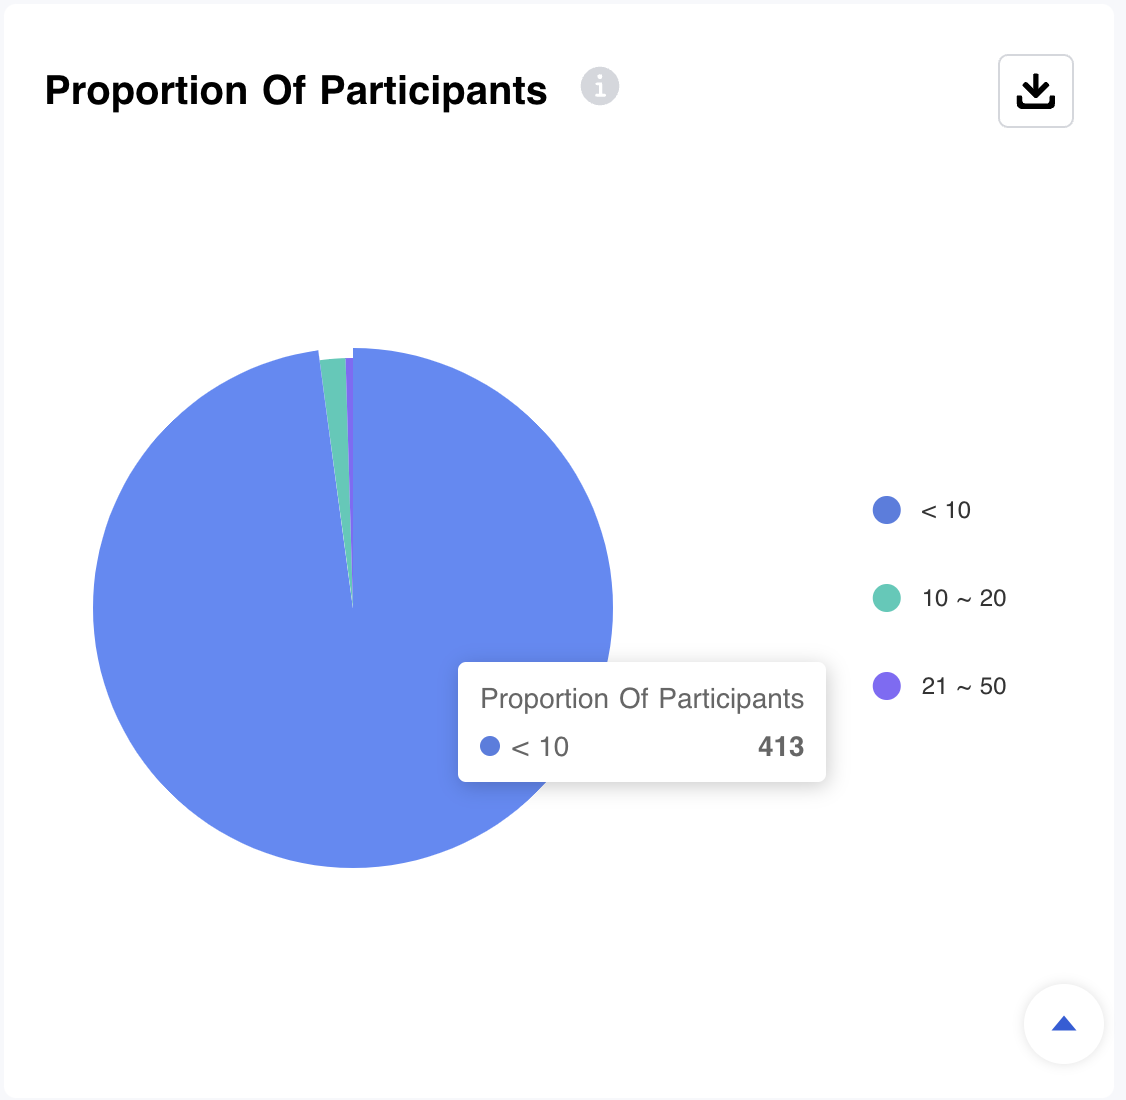
- The Proportion of Participants - Distribution of conference participants.
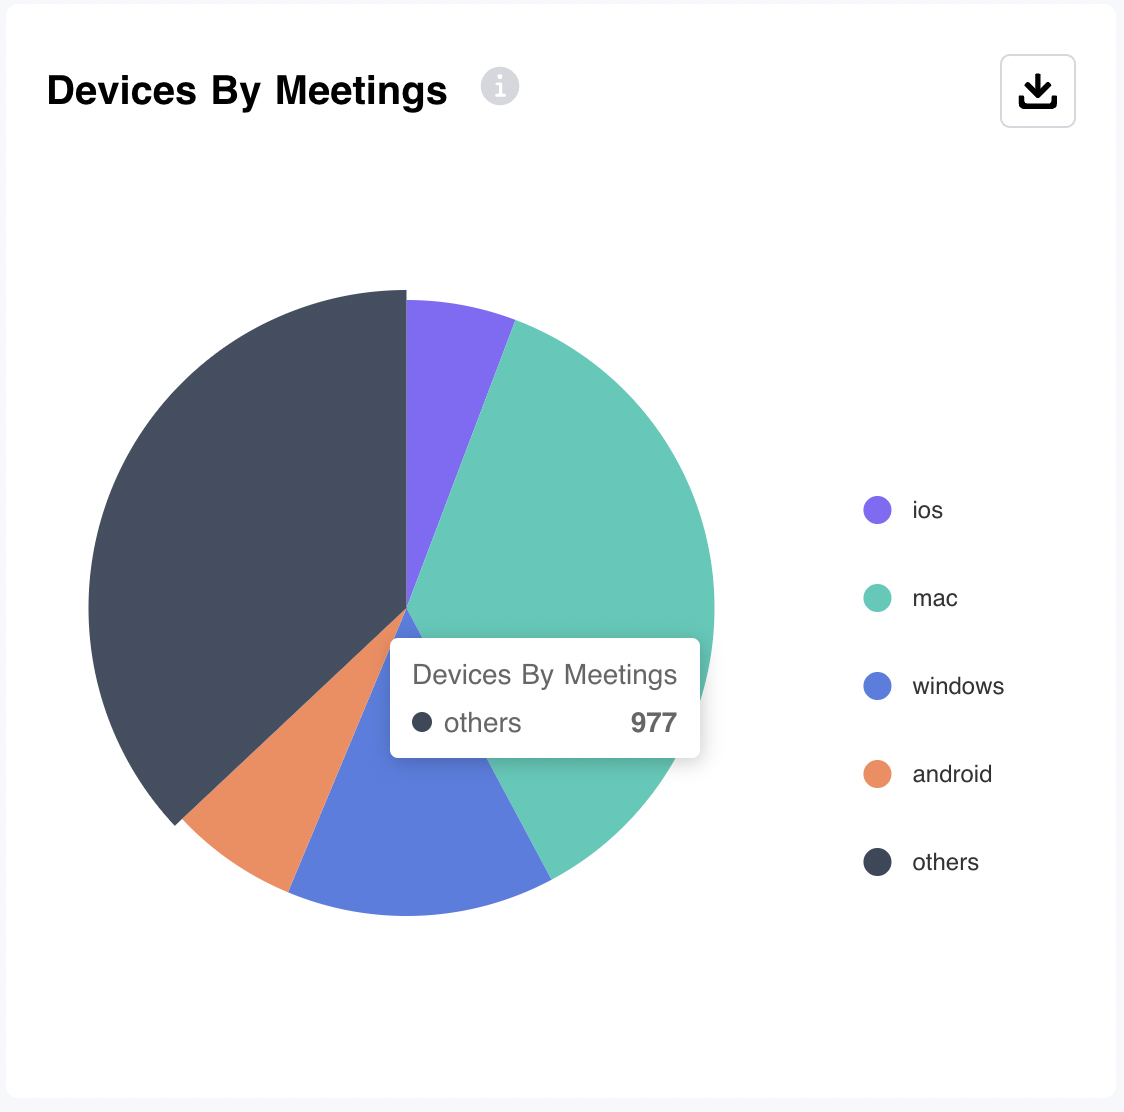
- Devices By Meetings - Displays a percentage breakdown of the types of devices participants have used to join meetings.
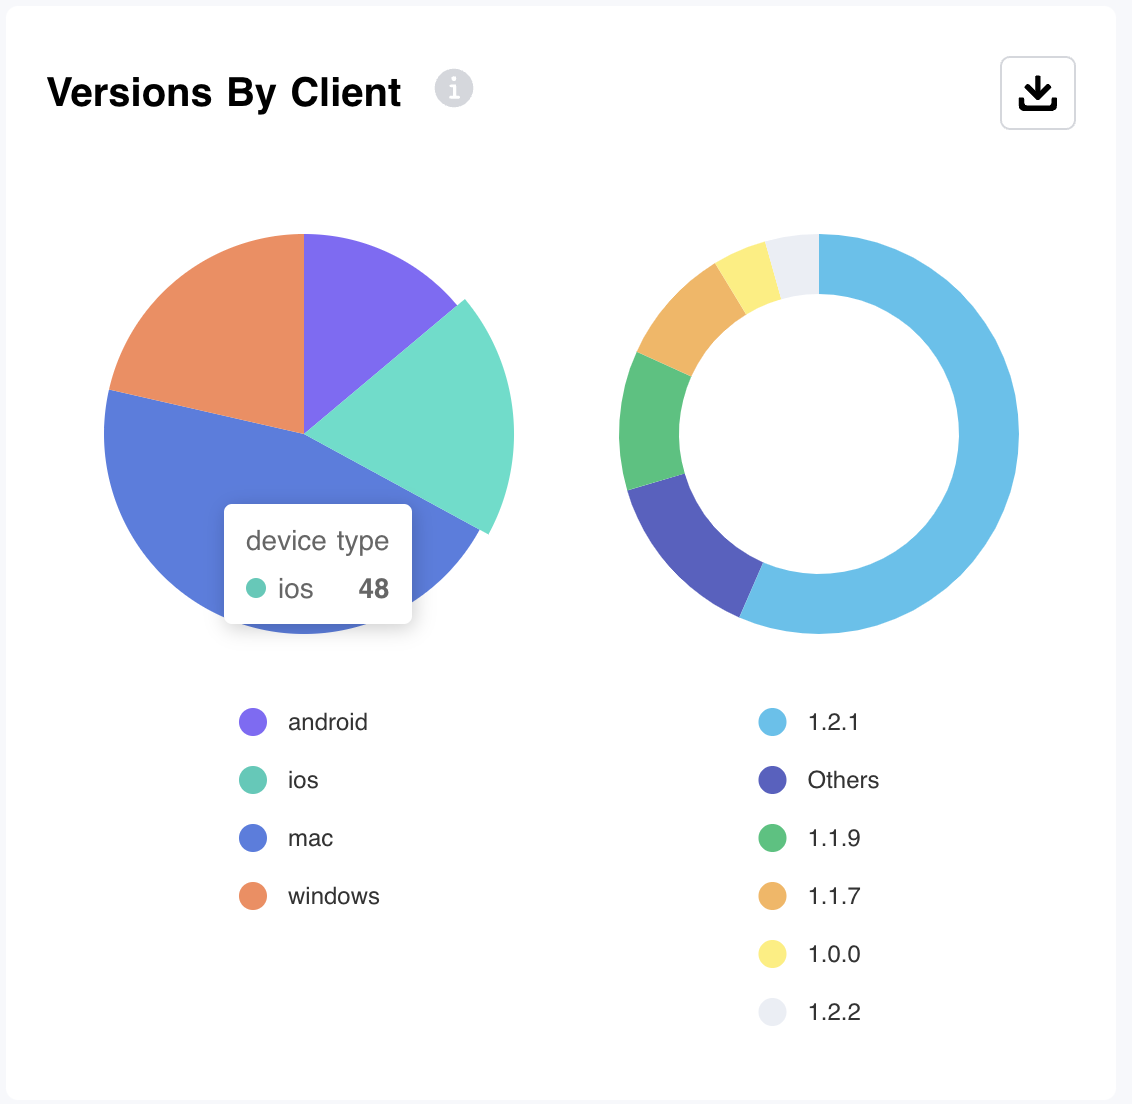
- Versions By Client - Displays a percentage breakdown of the Matrx version used on the devices participants have used to join meetings.
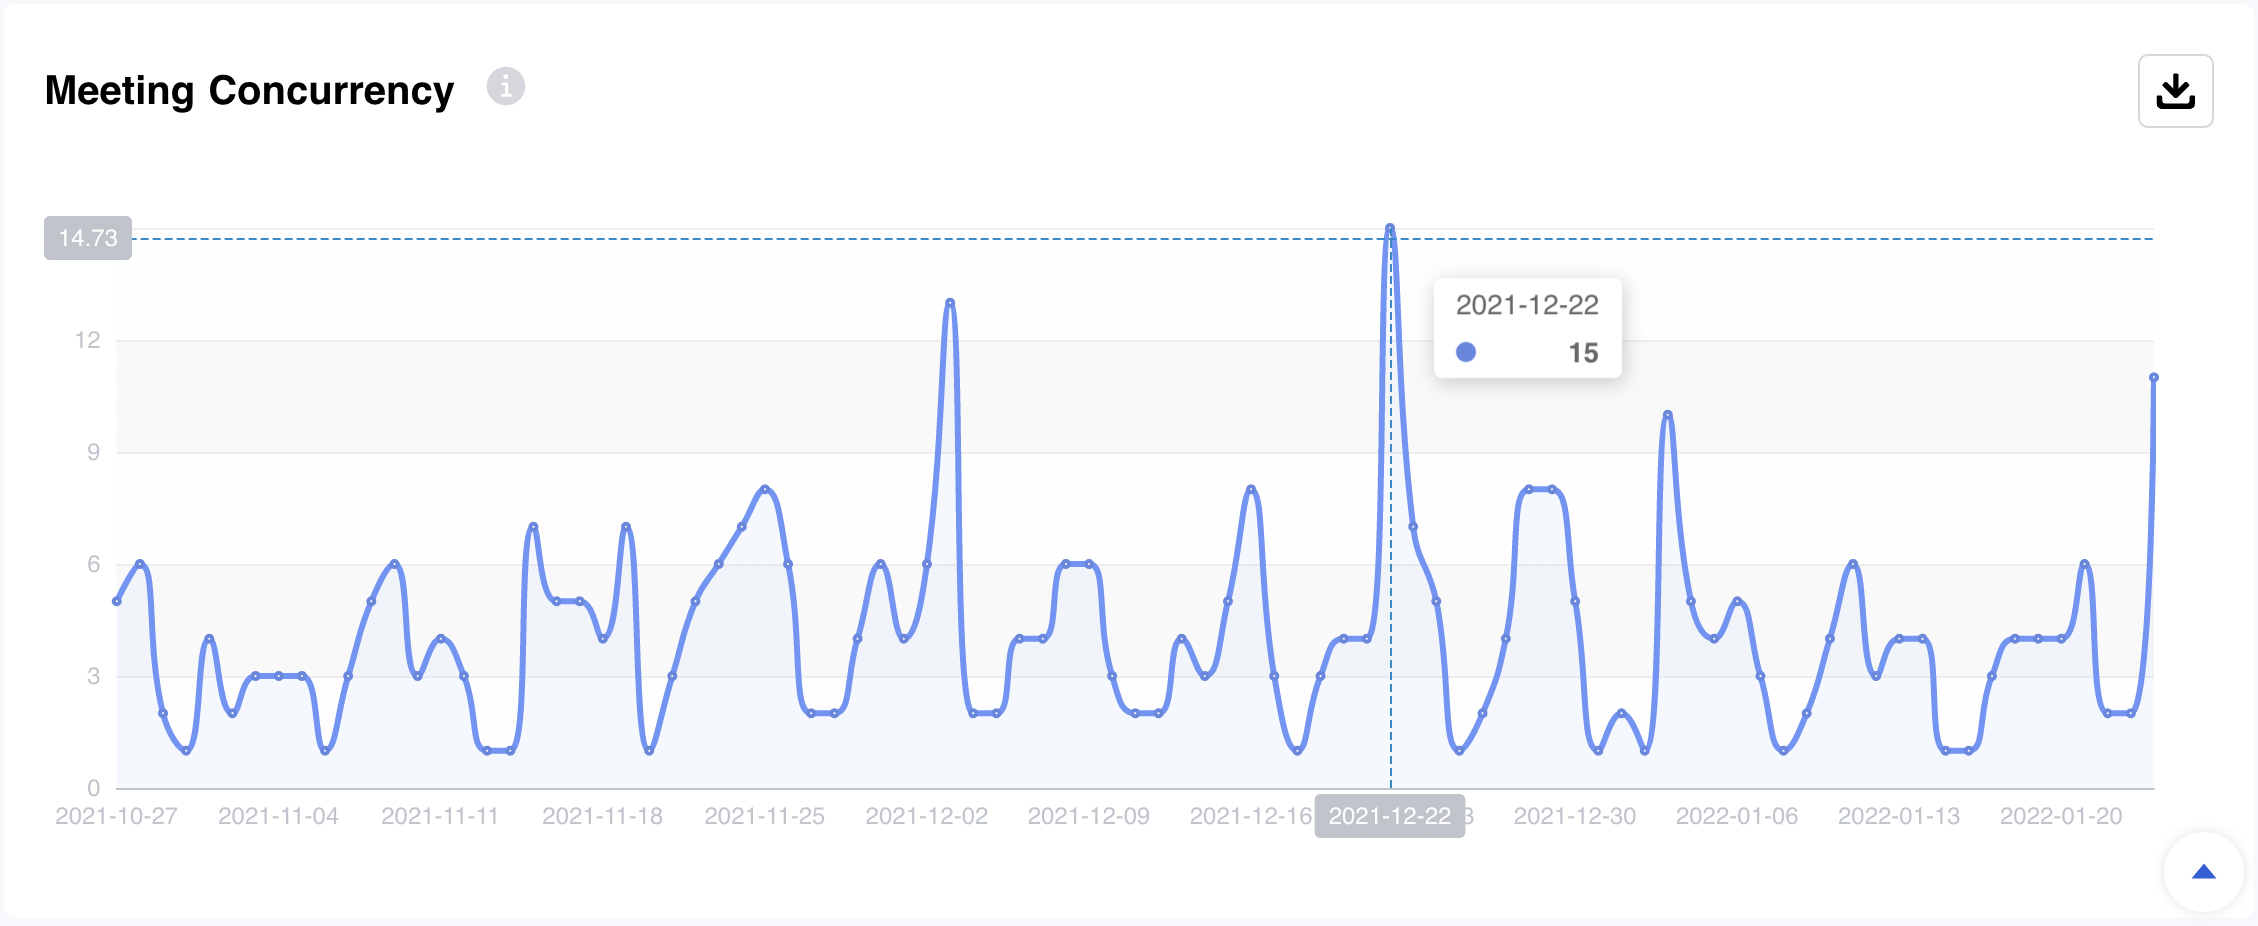
-
Meeting Concurrency - Displays the concurrency of daily meetings.
Download Usage Report
Admins are allowed to export usage reports in PDF or CSV format for every single chart.